Click anywhere on the map to see the possible surface origin locations.
We use this information to determine how much bias is caused to sedimentary microplankton assemblages by lateral transport of the sinking particles by ocean currents. This tool could be applied to any sinking particle in the ocean.
If you use planktondrift.org for research purposes, we ask you to cite our papers:
Frequently Asked Questions
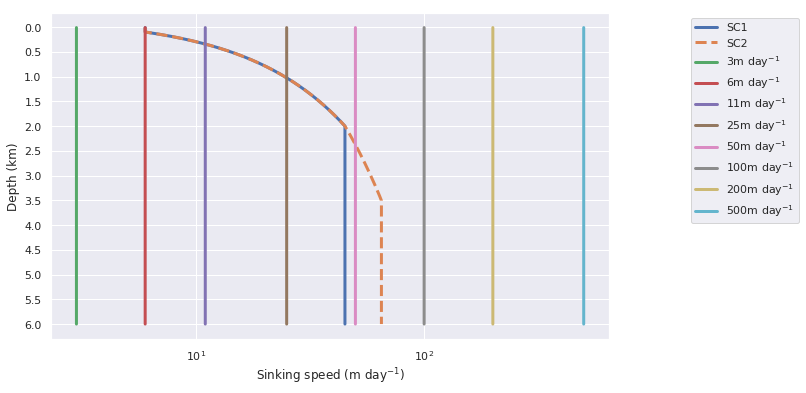
Q: What are the sinking speeds 'SC1' and 'SC2?'
A: These are two sinking scenarios based on measurements (from sediment traps) of sinking aggregates in the ocean. In these measurements it was found that particles in general sink with an increasing sinking speed as the particles get deeper. The figure below summarises all sinking scenarios that are applied here (notice that the horizontal axis is logarithmic).
Q: What is the 'diffusion' parameter?
A: The diffusion parameter determines the strength of the stochastic diffusion that is added to the calculation of the particle trajectories. If the diffusion parameter equals zero, no stochastic diffusion is used. The stochastic diffusion is only used in the POP model.
Q: What are the environmental variables in the histogram?
A: These environmental variables (for example temperature and salinity) are recorded once a particle reached the ocean surface. This means that not only the origin location of the particle is provided, but also what the the temperature and the salinity were at the time that the particle started sinking.
Q: What are important differences between the OFES, NEMO and POP model?
A: The NEMO model is coupled to a biogeochemical model and provides more environmental variables.
The OFES model stops at 75° North and South, so for any analysis at high latitudes we recommend to use the NEMO model. More sinking scenarios are applied in OFES compared to NEMO.
The POP model has both a 1° and a 0.1° horizontal resolution version, which allows to study the differences of the technique with different model resolutiuons.
For details about both models we refer to the websites of the models: OFES, NEMO or POP, or the paper. In POP we use four different configurations (see the table), with flow fields from different model resolution and with different temporal output. Diffusion can only be added in some of the configurations, by the addition of stochastic noise in the calculation of the trajectory (where the magnitude of the noise is determined by the number). See the manuscript for the details.
| Model | Horizontal resolution | Output | Diffusion | Remark |
|---|---|---|---|---|
| OFES | 0.1 ° | 3-daily | no | |
| NEMO | 0.1 ° | 5-daily | no | |
| POP01 | 0.1 ° | 5-daily | no | |
| POP01m | 0.1 ° | monthly | no | |
| POP1m | 1 ° | monthly | yes | |
| POP1mb | 1 ° | monthly | yes | Also uses the bolus velocity from the Gent-McWilliams parameterisation for eddy-induced mixing |
Q: Why does the site say "You clicked on land, please click on the ocean", while I actually clicked on ocean?
A: In these simulations, particles are released at the bottom of the ocean until they almost reach the surface. They are stopped once they reach 10m depth. This means that no particles are released at a location if the ocean is 10m deep or shallower, and the location is considered as land.
Q: Can I export the raw data from the experiment? / Can I have multiple release points?
A: If you want something more 'fancy' than what the site can provide, there are two options. You could code the particle transport yourself with oceanparcels. The code that we used is available at Github. Otherwise, contact us. We're happy to help out!
Q: How do I to cite the paper?
A: Nooteboom, P. D., Bijl, P. K., Sebille, E., Heydt, A. S., & Dijkstra, H. A. (2019). Transport bias by ocean currents in sedimentary microplankton assemblages: Implications for paleoceanographic reconstructions. Paleoceanography and Paleoclimatology, 34, 1178-1194, https://doi.org/10.1029/2019PA003606
How does it work?
Driven by the sun and the wind, our oceans develop currents and eddies. These currents move through three dimensions. Many rise from the deep ocean near coastlines while other currents descend to the deepest parts of the ocean. These vertically descending currents are often, but not always, in the middle of the ocean in regions known as the five gyres. These gyres are giant vortices spanning the whole ocean basin where water at the surface slowly spirals inwards until it sinks.
All particles that sink to the bottom of the ocean are displaced by these currents. If one clicks on a location in the ocean of the map, one can see where a particle which is found at the bottom of the ocean could originate from at the surface before it started sinking.
How are the origin locations of the particles determined?
The origin locations of the particles are determined with use of a state-of-the-art climate model: Ocean General Circulation Model for the Earth Simulator (OFES), Nucleus for European Modelling of the Ocean (NEMO) or the Parallel Ocean Program (POP). The climate model provides a three dimensional flow field of the ocean currents. Particles are released in this flow field every three days for a period of six years at the bottom of the ocean and tracked back in time along the flow field (which is changing in time). Because the particles are assumed to be heavier than the water and sinking, a vertical sinking velocity is added to the velocity along the transport.
Why do we care about the lateral transport of microplankton?
Climate scientists make climate reconstructions of past climate, to project what will happen with the climate in the future. Fossils of microplankton in the sediments at the bottom of the ocean are a useful tool to make these reconstructions, because some of them occur in specific environments at the surface of the ocean. For example, if one only finds microplankton species in a subtropical region in the modern day, and the same species at the North pole in another time period, this means that the North pole must have been warmer in this time period. However, it could be that the microplankton was transported to the North Pole. This means that the lateral transport of the microplankton by ocean currents could induce a bias of the sedimentary assemblages at the bottom of the ocean.
Why can we apply this tool to any sinking particle?
The size, form and weight of a particle determine its sinking speed. Since we assume a constant sinking speed in this tool, one can apply this tool to any particle once its sinking speed is determined/approximated. The options 'S1' and 'S2' are the sinking speed scenarios for general sinking aggregates, which are based on measurements (see the FAQ).
For more information about the particle-track method, the transport bias of microplankton proxies and the sinking speed of particles, see the paper Transport bias by ocean currents in sedimentary microplankton assemblages: Implications for paleoceanographic reconstructions.
Download data
You can download the data of the experiment on the screen via the link below.
The data is a comma-separated file that should load into Excel. Each row corresponds to a particle which is released in the model at the bottom of the ocean and reached the surface of the ocean after backtracking. The first three columns are respectively the age (amount of days the particle sunk), the latitude and the longitude of the particle when it reached the surface. The other columns are the environmental variables (temperature (° C), salinity (psu), total primary productivity (mmolN/m3/d) and sea ice thickness (m)) when the particle reached the surface.
You are welcome and free to use the data in the file above for your scientific work. I just ask that you cite this scientific article in any publications that use the data. Both the data and the paper are licensed under a Creative Commons Attribution-NonCommercial-ShareAlike license. Map tiles by Stamen Design, under CC BY 3.0. Data by OpenStreetMap, under CC BY SA. plasticadrift.org was used as a template to build this website.
If you have any questions on how to use the data, please contact me.